DFMA: SHOULD COSTING
 DFMA: PRODUCT SIMPLIFICATION


What is a cost driver?
A cost driver is any factor that causes manufacturing cost to go up or down. Cost drivers can be design-related (geometry, tolerances, material choice), process-related (cycle time, setup, tooling), or volume-related (batch size, production rate). Every manufactured part has a handful of dominant cost drivers that account for most of its cost—and those are where DFM analysis focuses.
The cost driver definition in manufacturing is more specific than in general accounting. It's not just "what correlates with cost"—it's the identifiable design or process decision that causes cost to be what it is. Change the driver, change the cost.
On this page
Cost driver categories
Manufacturing cost drivers fall into four broad categories. Understanding which category dominates helps teams target the right lever:
- Material grade and specification
- Stock form and size (bar, plate, coil, billet)
- Buy-to-fly ratio (material utilization)
- Scrap rate and offcut recovery
- Minimum order quantities and lead time
- Cycle time (machining, forming, cooling, curing)
- Number of operations and tool changes
- Feed rates and speeds (constrained by geometry)
- Cooling and solidification time (molding, casting)
- Machine selection and hourly rate
- Number of setups and orientations
- Fixture complexity and custom tooling
- Tool wear rate and replacement frequency
- Mold/die complexity (cavities, actions, lifters)
- Batch size effect on per-unit setup cost
- Deburring and edge finishing
- Surface treatment (anodize, plate, paint)
- Inspection and measurement burden
- Hand work (polish, EDM, fit-and-adjust)
- Testing and validation
Cost driver examples
Here are specific, concrete cost driver examples showing the design decision, the cost impact, and the DFM fix:
| Cost driver | Design decision | Cost impact | DFM fix |
|---|---|---|---|
| Small internal radii | 1 mm corner radius in pocket | Forces 2 mm end mill, slow multi-pass finishing | Increase to 3 mm → standard 6 mm tool, cycle time ↓ 15–20% |
| Non-uniform wall thickness | Walls vary 1.5–4.0 mm in molded housing | Extended cooling, sink marks, warpage risk | Uniform 2.5 mm with ribs → cooling time ↓ 25% |
| Broad tight tolerance | ±0.05 mm across entire face | Extra setup, slow finishing pass, 100% inspection | Localize ±0.05 mm to interface only → inspection ↓, setup ↓ |
| Cosmetic finish on hidden face | Ra 0.8 µm specified all surfaces | Hand polishing or extra machining pass on non-visible areas | Ra 0.8 on mating/visible faces only → secondary ops eliminated |
| Undercuts in mold | Feature requires side-action in injection mold | +$5K–15K tooling, slower cycle, more maintenance | Redesign as snap feature or split line change → side-action eliminated |
| Multiple setups | Features on 4 sides require 4 fixtures | 4× setup time, fixture cost, alignment risk | Consolidate critical features to 2 orientations → setups ↓ 50% |
Cost drivers by manufacturing process
Different processes have different dominant cost drivers. Here's what typically drives the most cost in each:
- #1 Cycle time — toolpaths, tool changes, finishing passes
- #2 Setup time — number of orientations and fixtures
- #3 Secondary ops — deburr, ream, EDM, hand polish
- #4 Material waste — buy-to-fly ratio on prismatic parts
- #1 Cooling time — wall thickness, uniformity, mold design
- #2 Tooling cost — complexity, side-actions, cavitation
- #3 Material cost — resin grade, fill rate, runner waste
- #4 Scrap/yield — warpage, short shots, cosmetic defects
- #1 Setup count — bends, punch hits, secondary forming
- #2 Material utilization — nesting efficiency, scrap
- #3 Welding/joining — weld length, joint prep, fixtures
- #4 Finishing — deburr, tumble, powder coat, plating
- #1 Die cost — complexity, size, expected life
- #2 Cycle time — solidification, ejection, die spray
- #3 Secondary machining — features that can't be held as-cast
- #4 Scrap rate — porosity, flash, dimensional variation
The "silent" cost drivers
Some of the most expensive cost drivers don't show up in obvious places. They're embedded in specs, notes, and assumptions that seem harmless on the drawing but create real cost in production:
- Cosmetic finishes on non-visible surfaces
- Tolerances tighter than function requires
- Material grades driven by "what we always use"
- Deburr/tumble not on routing but always done
- 100% inspection because tolerances are marginal
- Rework loops that are accepted as normal
- Machining a part that could be cast or forged
- Using a 5-axis when 3-axis geometry would work
- Low-volume parts on high-rate machines (or vice versa)
How DFMA identifies cost drivers
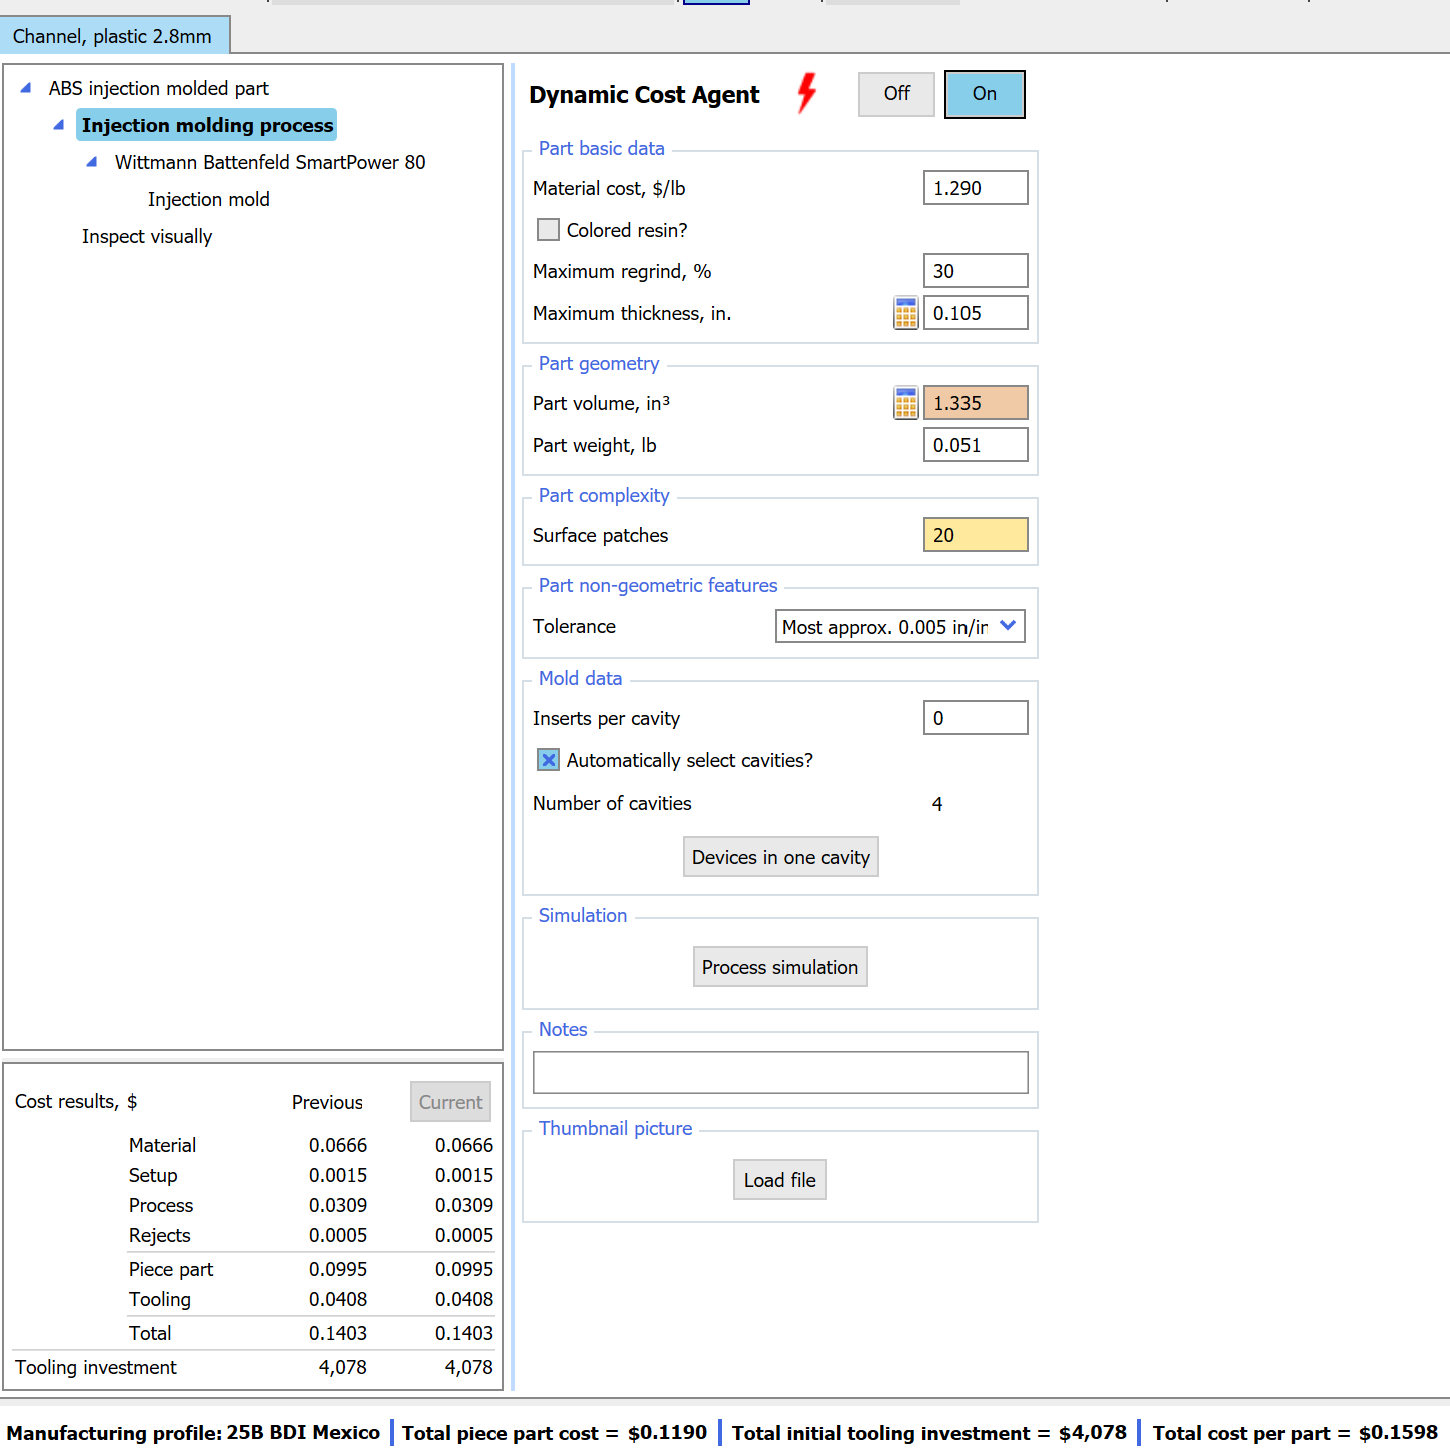
DFMA identifies cost drivers by building a transparent should-cost model for the selected process, region, and production scenario—then showing which inputs and assumptions move the result. In DFMA, unit cost is broken into core components: process & setup, material, tooling, and profit. As you adjust key decisions (process choice, machine/rate assumptions, setup strategy, stock selection, finishes/tolerances), the model updates and the dominant drivers become clear.
With Dynamic Cost Agent enabled, DFMA runs additional simulations to determine which drivers are actually meaningful for this design and scenario—so teams spend time on the few levers that will materially change cost, rather than chasing noise.
- Unit-cost breakdown by component: process & setup, material, tooling, and profit
- The assumptions and inputs behind each component (rates, setups, operations, stock selection, scenario)
- Which design/spec choices are creating cost (e.g., requirements that trigger extra operations or tighter capability needs)
- How alternatives (process, region, and scenario) change the cost profile
- Cleaner, part-specific focus when Dynamic Cost Agent filters out low-impact drivers
- Design iteration: adjust inputs, re-run, and see how the cost model responds as details evolve
- Should-cost analysis: build a defensible benchmark for supplier conversations
- Process selection: compare scenarios across processes and regions to find the right manufacturing path
- Design reviews: align engineering, manufacturing, and procurement on the few drivers that move the needle
Example: how changing one cost driver impacts unit cost
Scenario: injection-molded housing with non-uniform wall thickness (the #1 cost driver for molded parts). A single design change—uniformizing wall thickness—cascades through multiple cost components:
| Cost component | Before (variable walls) | After (uniform 2.5 mm) | Impact |
|---|---|---|---|
| Cooling time | 38 sec | 28 sec | ↓ 26% |
| Cycle time (total) | 52 sec | 42 sec | ↓ 19% |
| Scrap rate | 4.5% (sink/warp) | 1.8% | ↓ 60% |
| Material per part | 42 g | 38 g (with ribs) | ↓ 10% |
| Per-unit cost | $2.85 | $2.18 | ↓ 24% |
One cost driver change. Four cost components improved. This is why cost-driver thinking is more effective than line-item negotiation—it addresses the cause rather than pressuring the price.
Values are illustrative. Actual results depend on resin, mold design, machine, and volume. DFMA calculates these from your specific part and process assumptions.
How to reduce cost drivers through design
The most effective way to reduce manufacturing cost drivers is through design changes—not supplier pressure. Here's the DFM approach to each category:
- Increase radii to allow larger, faster tools
- Simplify geometry to reduce operations and tool changes
- Uniform wall thickness to minimize cooling/solidification
- Design for fewer orientations/setups
- Specify finish only where function requires it
- Localize tight tolerances to functional interfaces
- Design self-deburring geometry where possible
- Eliminate features that force EDM or hand work
- Design for standard tooling and fixtures
- Eliminate undercuts and side-actions in molds
- Consolidate features to reduce fixture count
- Add draft to all vertical surfaces for clean ejection
- Optimize geometry for near-net-shape processing
- Use standard stock sizes and forms
- Evaluate material substitution (same function, lower cost)
- Improve nesting and reduce offcut waste
For a complete methodology, see Design for Manufacturing (DFM). For total product cost optimization that includes assembly simplification, see What Is DFMA?
Frequently asked questions
What is a cost driver in manufacturing?
A cost driver is any factor that causes manufacturing cost to increase or decrease. Cost drivers can be design-related (geometry, tolerances, material choice), process-related (cycle time, setup, tooling), or volume-related (batch size, production rate). Identifying the dominant cost drivers for a specific part is the foundation of effective cost reduction.
What are examples of manufacturing cost drivers?
Common cost drivers include cycle time, setup time and changeovers, tooling complexity and wear rate, material utilization and scrap rate, secondary operations (deburr, finish, inspect, EDM), tolerance tightness requiring slower processes, and features that force small tools or awkward fixturing.
What is the difference between a cost driver and a cost component?
A cost component is a category of cost (direct materials, direct labor, manufacturing overhead). A cost driver is the underlying factor that determines how much a component costs. For example, "direct labor" is a component; "number of setups" is a cost driver within that component.
How does DFM identify cost drivers?
DFM software like DFMA identifies cost drivers by building a transparent should-cost model around a selected process, region, and production scenario. DFMA breaks unit cost into key components—process & setup, material, tooling, and profit— and shows how the underlying inputs (operations, machine/rate assumptions, setup choices, stock selection, and specification-driven requirements) affect each component. With Dynamic Cost Agent enabled, the software uses additional simulations to focus attention on the cost drivers that are truly impactful for that specific part and scenario.
Which cost drivers have the biggest impact?
The highest-impact drivers vary by process and part, but cycle time and secondary operations consistently rank at the top. Features that force small tools, extra setups, tight tolerances, or post-process finishing often add more cost than the raw material itself.
Can you change cost drivers without changing function?
Yes. Many of the biggest cost drivers are caused by specifications or geometry choices that don't affect function—an overly tight tolerance on a non-critical face, a small radius that forces a tiny tool, or a cosmetic finish spec on a hidden surface. DFM identifies these opportunities so teams can reduce cost without compromising performance.
See the cost drivers behind your part
Bring a cost-critical part. We'll show which design decisions are driving cost—ranked by impact—and what changes move the needle most.