DFMA: SHOULD COSTING
 DFMA: PRODUCT SIMPLIFICATION


What is total manufacturing cost?
Total manufacturing cost is every expense incurred to transform raw materials into a finished part or product on the factory floor. It is the baseline for unit cost, margin analysis, make-vs-buy decisions, and supplier negotiations.
Total manufacturing cost is composed of three primary components: direct materials, direct labor, and manufacturing overhead. Each has its own set of cost drivers—and understanding which drivers dominate for a given part is what separates informed cost reduction from across-the-board cost pressure.
On this page
The manufacturing cost formula
The formula is simple. The challenge is understanding what's inside each term—and which design decisions are driving each component up. That's where most cost-reduction opportunities live.
The three cost components
Raw materials consumed in the part: bar stock, sheet, resin pellets, castings. Includes material cost, buy-to-fly ratio (how much material is removed vs. retained), and scrap value.
- Material grade and specification
- Stock size and form (bar, plate, coil)
- Buy-to-fly ratio / material utilization
- Scrap and offcut recovery
Operator time directly attributable to production: machine tending, setup, loading/unloading, manual operations. Includes labor rate and setup time amortized across the batch.
- Operator cycle time (load/unload/tend)
- Setup and changeover time
- Manual operations (deburr, inspect, finish)
- Batch size effect on per-unit setup
Everything else on the factory floor: machine time, tooling amortization, energy, maintenance, facility allocation, quality overhead.
- Machine hourly rate × cycle time
- Tooling and fixture amortization
- Energy, consumables, coolant
- Facility and equipment depreciation
Cost drivers behind each component
Each cost component has underlying cost drivers—the specific design and process decisions that determine how much that component actually costs. Reducing manufacturing cost means identifying which drivers have the most impact and addressing them through design changes.
| Component | Key cost drivers | Design leverage |
|---|---|---|
| Direct materials | Material grade, stock form, buy-to-fly ratio, minimum order quantities | Near-net-shape processes, nesting, standard stock sizes, material substitution |
| Direct labor | Setup count, manual operations, batch size, operator skill required | Reduce setups via accessible features, eliminate hand-finish, increase batch |
| Manufacturing overhead | Cycle time, tooling complexity, machine selection, yield/scrap | Simplify geometry, relax non-functional tolerances, standard tooling, improve yield |
For a deep dive into how cost drivers work across processes, see Cost Drivers in Manufacturing.
How to calculate manufacturing cost per unit
Per-unit manufacturing cost divides total cost by units produced. The key is capturing all components accurately—especially costs that are amortized across a production run.
- 1. Material cost per unit: raw material cost × (1 + scrap rate), adjusted for stock utilization
- 2. Processing cost per unit: machine rate × cycle time per part
- 3. Setup cost per unit: (setup time × labor rate) ÷ batch size
- 4. Tooling cost per unit: total tooling cost ÷ expected tool life (in parts)
- 5. Secondary ops per unit: time × rate for each post-process (deburr, finish, inspect)
- 6. Sum all components for total per-unit manufacturing cost
- Ignoring setup cost on small batches (it can dominate per-unit cost)
- Underestimating secondary operations (deburr, inspect, finish)
- Using material weight alone without accounting for stock form and waste
- Applying flat overhead rates instead of process-specific machine rates
- Not adjusting for yield losses (scrap × rework)
How DFMA models manufacturing cost
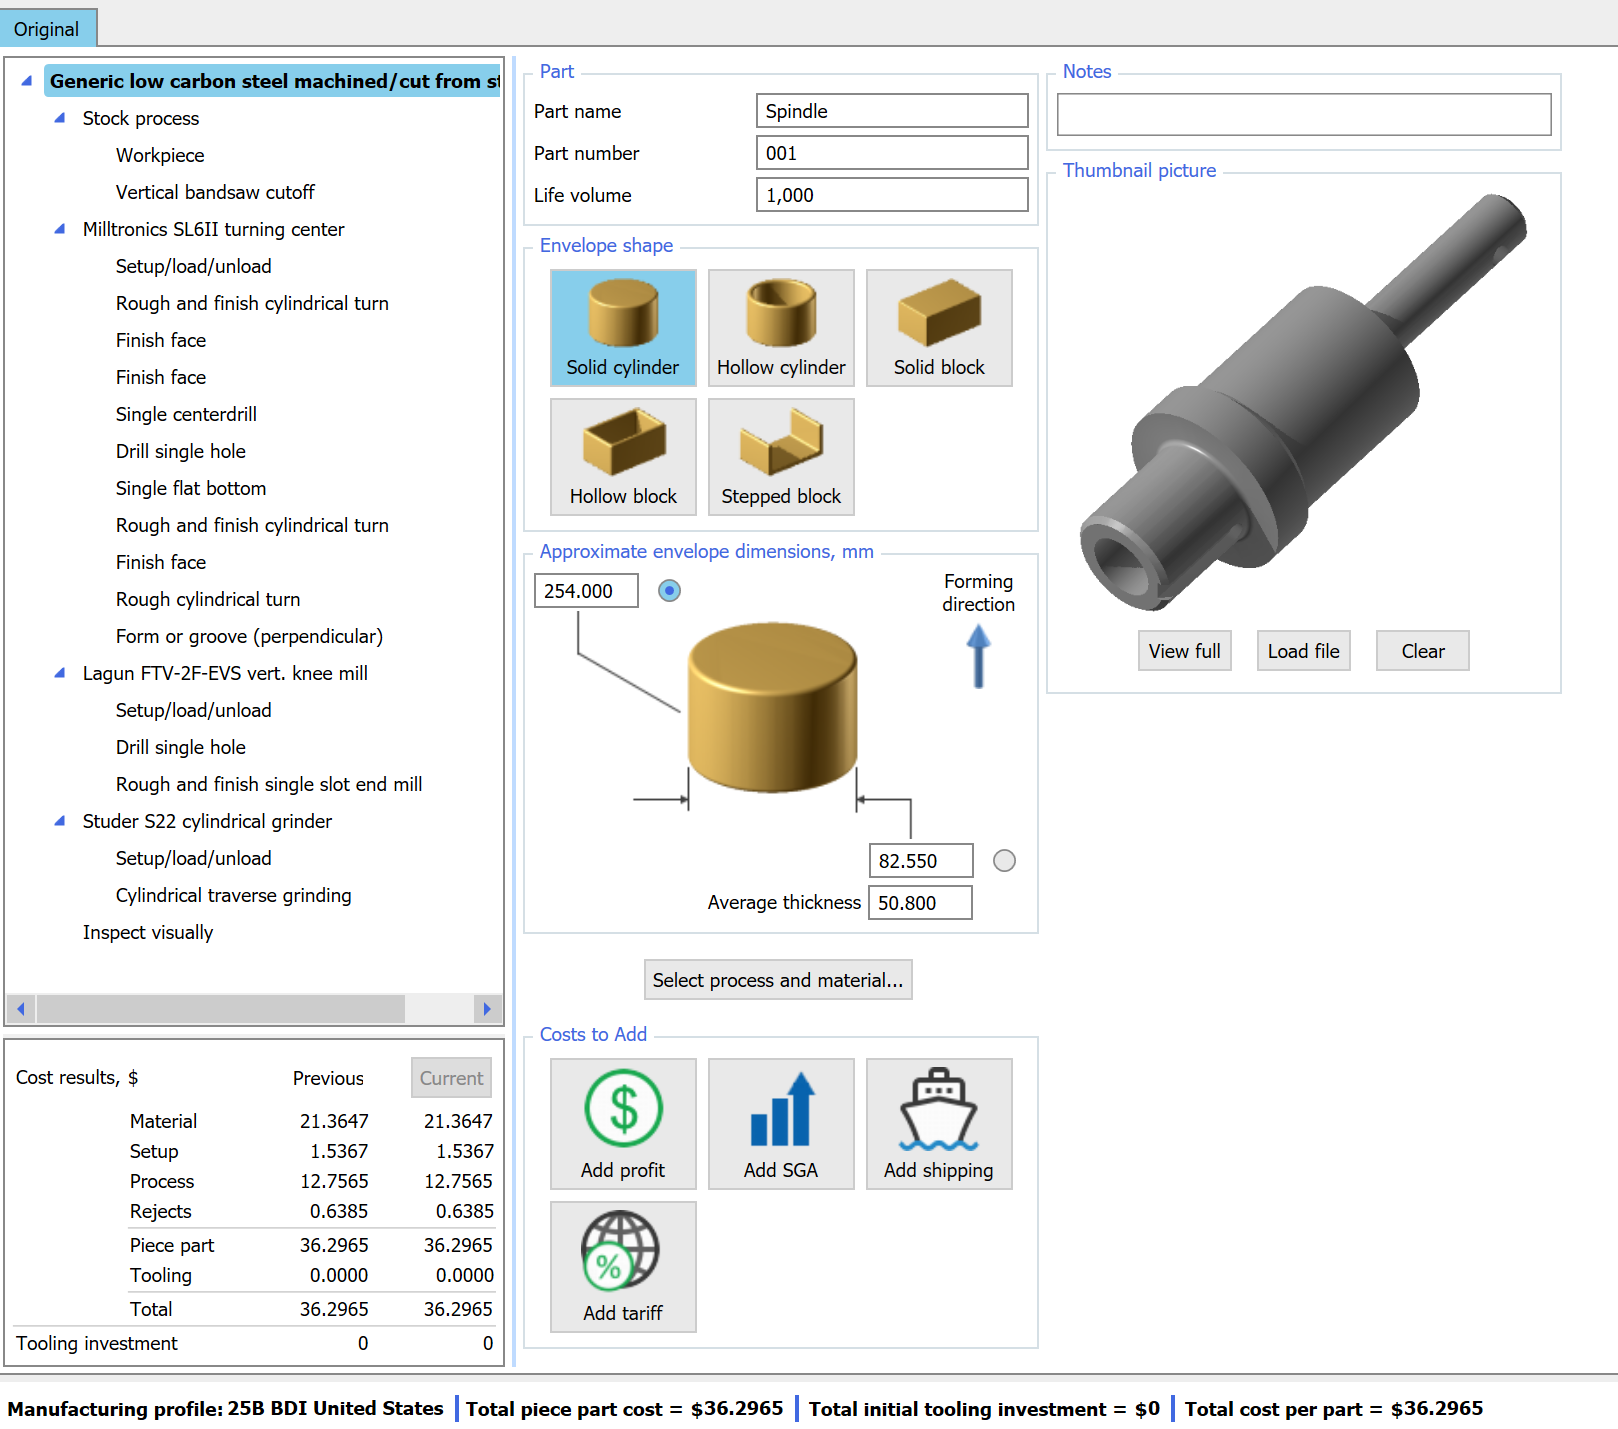
DFMA Should Costing builds cost estimates from first principles rather than historical averages or supplier quotes. For each part, the software models the actual manufacturing process—material removal, forming, cooling, assembly—and calculates each cost component based on geometry, process parameters, and production assumptions.
- Material cost from geometry, stock form, and utilization
- Process time from toolpaths, feeds/speeds, cooling, forming
- Setup time from operations, orientations, and fixture changes
- Tooling amortization from tool life models and production volume
- Secondary operations costed individually (deburr, inspect, finish, test)
- Visibility: see exactly which component dominates and why
- Iteration: change geometry or specs, re-run, watch cost components shift
- Defensibility: cost estimates are based on transparent assumptions, not black boxes
- Negotiation: use detailed breakdowns as the basis for supplier should-cost discussions
Worked example: machined aluminum bracket
Here's an illustrative cost breakdown for a CNC-machined aluminum bracket at two production volumes, showing how each cost component shifts with scale:
| Cost component | 500 units | 5,000 units | Note |
|---|---|---|---|
| Direct materials | $4.20 | $3.85 | Volume pricing on bar stock |
| Processing (machine time) | $8.50 | $8.50 | Cycle time unchanged by volume |
| Setup (amortized) | $2.40 | $0.24 | 10× reduction at volume |
| Tooling (amortized) | $1.80 | $0.18 | Tooling spread across more units |
| Secondary ops | $2.10 | $2.10 | Deburr + inspect, time-based |
| Total per unit | $19.00 | $14.87 | 22% lower at volume |
Key takeaway: at 500 units, setup and tooling account for 22% of per-unit cost. At 5,000 units, they drop to 3%. Understanding this structure is essential for quoting, make-vs-buy, and design-to-cost decisions.
Values are illustrative. Actual costs depend on geometry, material, machine rates, and shop-specific overhead. DFMA calculates these from your specific part and process assumptions.
How to reduce manufacturing cost
Reducing manufacturing cost effectively means targeting the right component. Here's where to look depending on what's dominating your cost structure:
- Switch to near-net-shape process (casting, forging) to reduce waste
- Optimize stock form and nesting
- Evaluate material substitution (same function, lower cost grade)
- Improve buy-to-fly ratio through geometry changes
- Simplify geometry to reduce tool changes and passes
- Increase radii to allow larger, faster tools
- Reduce setups by designing for fewer orientations
- Relax tolerances where function allows to enable faster feeds
- Specify finish only where functionally required
- Design self-deburring features or accessible edges
- Localize tight tolerances to reduce inspection scope
- Eliminate features that force EDM or hand work
- Design for standard tooling where possible
- Consolidate features to reduce fixture complexity
- Increase production volume to amortize over more units
- Evaluate process alternatives with lower tooling investment
The first step is always visibility: understand which component dominates before optimizing. This is exactly what Design for Manufacturing (DFM) provides—a structured way to see cost drivers and iterate toward target cost.
Frequently asked questions
What is total manufacturing cost?
Total manufacturing cost is the sum of all costs incurred to produce a finished good: direct materials, direct labor, and manufacturing overhead. Understanding the breakdown helps teams identify which components offer the most leverage for cost reduction.
What is the manufacturing cost formula?
Total Manufacturing Cost = Direct Materials + Direct Labor + Manufacturing Overhead. Direct materials are the raw inputs consumed by the part. Direct labor is the operator and setup time. Manufacturing overhead includes machine time, tooling amortization, energy, maintenance, and facility allocation.
How do you calculate manufacturing cost per unit?
Divide total manufacturing cost by the number of units produced. For accurate per-unit cost, include amortized tooling, setup time spread across the batch, and yield losses. DFMA software calculates this automatically using process-specific models and production volume assumptions.
What is the difference between manufacturing cost and production cost?
Manufacturing cost covers direct materials, direct labor, and manufacturing overhead—everything on the factory floor. Production cost is broader: it may also include logistics, quality assurance, packaging, and other costs required to deliver a finished product.
How does DFMA help reduce manufacturing cost?
DFMA models each cost component—material, process time, tooling, setup, secondary operations—from first principles. This visibility lets teams see exactly which design decisions drive cost, iterate on geometry and specs, and converge to target cost before supplier engagement.
What are the biggest manufacturing cost drivers?
The biggest cost drivers vary by process but typically include cycle time, setup time and changeovers, tooling complexity and wear, scrap and yield losses, and secondary operations like deburring, finishing, and inspection.
See the real cost breakdown for your part
Bring a cost-critical part. We'll show exactly where manufacturing cost lives—material, process, tooling, secondary ops—and which design changes move the needle most.