DFMA: SHOULD COSTING
 DFMA: PRODUCT SIMPLIFICATION


What is should cost analysis?
Should cost analysis is a strategic approach to reducing the prices paid for parts and products by estimating the true manufacturing cost—then using that estimate to set realistic targets and negotiate with a shared, data-driven fact base. The process of building these estimates is often called should cost modeling.
Instead of forcing arbitrary price cuts, should-cost turns negotiation into an engineering-informed discussion about the drivers of cost. It is a core discipline within Design for Manufacture and Assembly (DFMA).
- Price ≠ cost. Quotes reflect commercial context; cost models explain what drives the number.
- Targets become defensible. Point to cycle time, yield, tooling, and routing—not opinions.
- Better conversations. Isolate the exact assumption causing the gap and resolve it.
On this page
Benefits and strategy
Many organizations set cost-reduction targets top-down and expect suppliers to comply. Without understanding underlying costs, that often becomes an argument about price—rather than a discussion about what truly drives manufacturing cost.
Should cost analysis closes that gap by comparing supplier quotes to an independent estimate of what the part should cost to make.
- Better outcomes: savings come from real cost drivers, not strained relationships.
- Faster alignment: procurement, engineering, and suppliers discuss the same assumptions.
- More resilient supply base: targets are achievable without pushing efficient suppliers into unsustainable margins.
What-if scenario modeling
DFMA Should Costing provides transparent access to an extensive database of manufacturing labor, materials, methods, and machinery costs—built via decades of research and continually optimized by experts. Change any input and immediately see the impact on cost.
- What if the region of manufacture changed?
- What if material prices went up or down by X%?
- What if the supplier used a different machine?
- What if we used a different material?
- What if we used different sheet sizes for sheet metal parts?
- What impact does the percentage of regrind have on injection-molded parts?
- What if labor rates increase or decrease by X%?
Everything you need to calculate real-world manufacturing costs is accessible, including the ability to access the underlying database to adjust inputs and immediately see the effect changes have on the resultant costs. Regional cost data is available through the Global Costing Data module, which covers labor, materials, and overhead rates across manufacturing regions worldwide.
The important difference between price and cost
A common pitfall is relying on historical price as a proxy for cost. Historical pricing reflects past deals, volumes, market timing, and supplier strategy—it does not reflect the cost structure of a new part or routing.
Should cost analysis removes the anchoring effect of historical prices by focusing on materials, processing, setup, tooling, and yield. Negotiation then becomes a targeted discussion: where does the model differ from the quote, and which assumption explains the gap?
- What you paid before
- Past volumes and market timing
- Previous supplier strategies
- What drives the cost today
- Which assumptions explain gaps
- Where to focus negotiation
Key components of a should cost model
DFMA Should Costing breaks down the cost of a part into process & setup, material, tooling, and profit components, each calculated with rigorous detail.

Process and Setup Costs
These costs are based on the hourly charge-out rates for a typical supplier—essentially modeling the scenario in which your company rents a machine and operator for the time needed to produce its parts.
- Machine depreciation
- Energy and consumables
- Floor-space allocation
- Selling, general, and administrative overhead
- Fully burdened labor for operators and maintenance
- Supplier profit for running the operation

Material Cost
A should-cost estimate uses fully burdened material cost per unit weight. DFMA models the supplier as an intermediary purchasing raw material, then selling that material to you in the form of finished parts.
- The base purchase price of the material
- Delivery to the supplier
- Administrative tracking within the facility
- Profit to compensate for buying, handling, and selling
Tooling Cost
Tooling costs are estimated from tool-supplier charge-out rates, which capture machine, consumable, and toolmaker labor costs—including profit. The model assumes your company rents equipment, purchases supplies, and hires a toolmaker for the time required to produce dedicated tooling.

Supplier Profit (Why a Single % Can Mislead)
The simplest way to account for supplier profit is a flat percentage of total manufacturing cost, but this approach ignores the varying levels of value-added labor across parts.
DFMA advocates applying separate profit margins to each cost component:
- Higher margins to setup and processing (reflecting labor and capital intensity)
- Lower margins to material (reflecting pass-through costs)
- Adjusted margins for dedicated tooling to reflect low production volumes
This ensures fairer cost distribution and prevents overpayment for parts with minimal value-added processes.
Should-cost model template
A well-structured should cost model breaks total part price into transparent, auditable components. The waterfall below shows how each driver builds toward the final cost—and where to look when a supplier quote seems high.
Cost Waterfall: How a Should-Cost Model Builds Up
Illustrative example. Actual proportions vary by part geometry, process, and volume.
Anatomy of a Should-Cost Model
Whether you build in a spreadsheet or dedicated should cost modeling software, every defensible should-cost model captures the same core layers. Here is the framework DFMA uses:
| Layer | What It Captures | Key Inputs |
|---|---|---|
| 1. Material | Raw material delivered to the supplier, including handling markup | Material grade, weight, buy price, delivery, scrap factor |
| 2. Processing | Machine time × chargeout rate for each operation in the routing | Cycle time, machine type, operator ratio, # of operations |
| 3. Setup | Changeover time amortized across the production batch | Setup duration, batch size, chargeout rate |
| 4. Tooling | Dedicated tooling (dies, molds, fixtures) amortized over tool life | Tool cost, expected life in parts, replacement frequency |
| 5. Scrap/Yield | Material and processing cost lost to defects or trim waste | Yield rate, defect rate, regrind percentage |
| 6. SG&A / Overhead | Facility, administration, and indirect costs allocated to the part | Overhead rate, floor-space allocation |
| 7. Profit | Supplier margin applied per component (not a flat %) | Margin rates for material vs. value-added work |
Tip: The most common mistake in spreadsheet-based models is applying a single profit percentage to the total. DFMA applies separate margins to material, processing, and tooling to reflect the different levels of value-added work—producing a more accurate and fairer estimate.
Real-world case studies
These examples span different industries and manufacturing processes. Each shows how a should-cost breakdown exposed the specific cost drivers behind the price gap—and where the savings came from. For more on how DFMA methodology supports this kind of manufacturing cost analysis, see our overview.
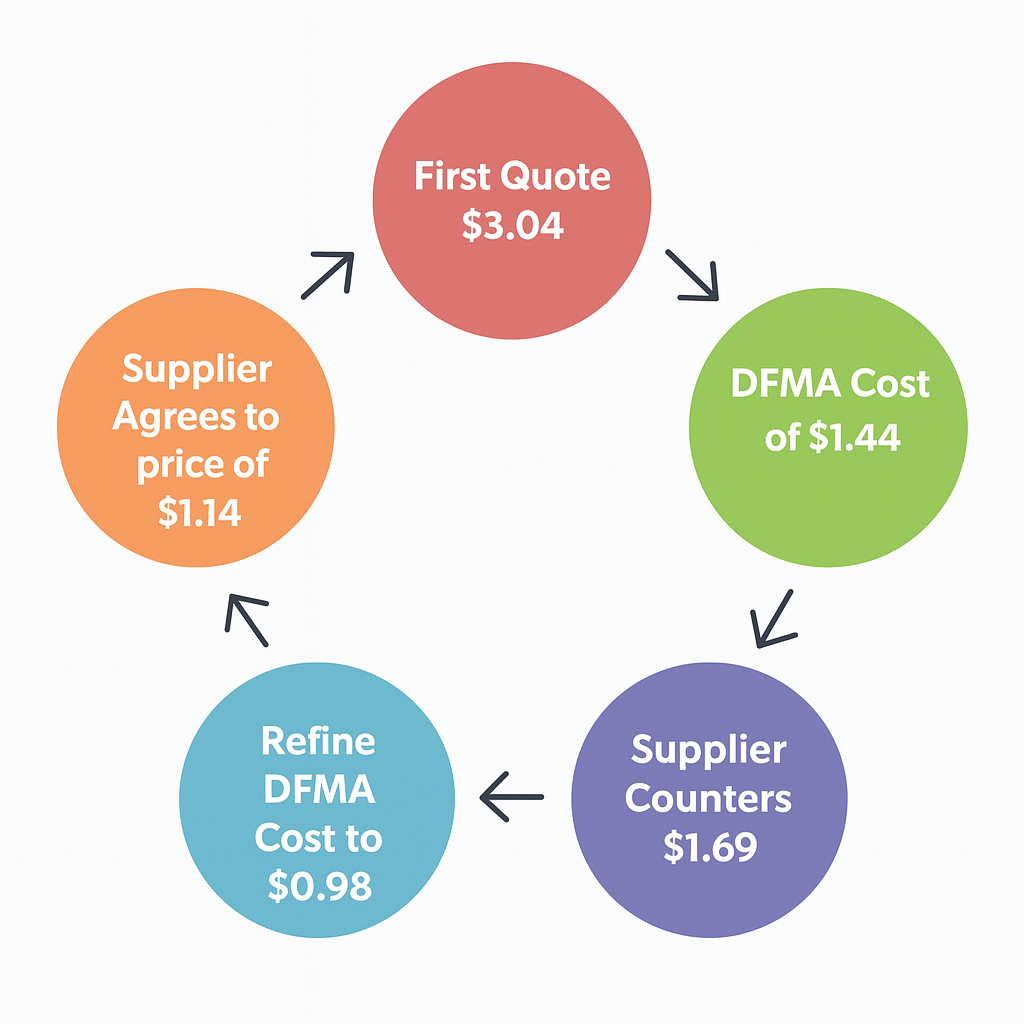
Plastic Clip Assembly—$361,000 Annual Savings
A supplier quoted $3.04 per unit for an injection-molded plastic clip assembly. DFMA Should Costing revealed the true manufacturing cost was significantly lower.
| Cost Component | Supplier Quote | DFMA Should-Cost | Gap |
|---|---|---|---|
| Material (ABS resin) | $0.48 | $0.44 | $0.04 |
| Processing (injection molding) | $1.12 | $0.74 | $0.38 |
| Setup (amortized) | $0.22 | $0.14 | $0.08 |
| Tooling (amortized) | $0.31 | $0.28 | $0.03 |
| Assembly & secondary ops | $0.52 | $0.31 | $0.21 |
| Overhead + profit | $0.39 | $0.32 | $0.07 |
| Total per unit | $3.04 | $2.23 | $0.81 |
Root cause: The supplier's cycle-time estimate for the molding operation was 40% higher than the DFMA model predicted for this part geometry and wall thickness. Assembly was also quoted as a manual two-station process when a single-station snap-fit design was feasible. Aligning on these two assumptions produced $361,000 in annual savings at the contract volume.
Die-Cast Aluminum Bracket—$1.2M Annual Savings
An automotive OEM received quotes from three suppliers for a high-volume aluminum die-cast structural bracket used in a powertrain assembly. The lowest quote was $8.72 per unit at 280,000 units/year. DFMA analysis identified over-specified tooling and an inflated cycle time as the primary cost gaps.
| Cost Component | Best Supplier Quote | DFMA Should-Cost | Gap |
|---|---|---|---|
| Material (A380 aluminum) | $2.14 | $2.06 | $0.08 |
| Die casting (800T machine) | $2.87 | $1.94 | $0.93 |
| CNC machining (2 ops) | $1.24 | $1.10 | $0.14 |
| Setup (amortized) | $0.31 | $0.22 | $0.09 |
| Tooling (die amortized) | $0.88 | $0.56 | $0.32 |
| Scrap / yield (5%) | $0.36 | $0.30 | $0.06 |
| Overhead + profit | $0.92 | $0.74 | $0.18 |
| Total per unit | $8.72 | $6.92 | $1.80 |
Root cause: The supplier quoted a 62-second die-cast cycle when DFMA's thermal model for the part's wall thickness and geometry predicted 43 seconds. The tooling cost assumed a four-cavity die where a two-cavity die met the annual volume requirement. By presenting the DFMA breakdown, the buyer and supplier aligned on cycle time and tooling configuration—resulting in $1.2M in annual savings while maintaining the supplier's target margin.
Representative analysis based on typical DFMA results. Specific figures are illustrative.
CNC-Machined Titanium Housing—$480,000 Annual Savings
A medical-device manufacturer sourced a CNC-machined titanium (Ti-6Al-4V) housing for a surgical instrument. The sole-source supplier quoted $142 per unit at 12,000 units/year. With no competing quotes, the procurement team used DFMA to build an independent baseline.
| Cost Component | Supplier Quote | DFMA Should-Cost | Gap |
|---|---|---|---|
| Material (Ti-6Al-4V bar stock) | $38.00 | $36.40 | $1.60 |
| CNC turning (op 1) | $28.50 | $21.80 | $6.70 |
| CNC milling (op 2 + 3) | $34.00 | $26.20 | $7.80 |
| Surface finishing & passivation | $9.60 | $8.40 | $1.20 |
| Setup (amortized) | $4.80 | $3.60 | $1.20 |
| Fixture tooling (amortized) | $5.10 | $3.90 | $1.20 |
| Inspection & documentation | $6.00 | $5.20 | $0.80 |
| Overhead + profit | $16.00 | $12.50 | $3.50 |
| Total per unit | $142.00 | $118.00 | $24.00 |
Root cause: The supplier's machining estimates assumed conservative feeds and speeds typical of a general-purpose shop. DFMA's process model for Ti-6Al-4V on a modern 5-axis CNC predicted 24% shorter cycle times with appropriate high-pressure coolant. The fixture tooling was also quoted for a single-part setup when a two-part fixture was feasible at this geometry. Negotiating on these two points yielded $480,000 in annual savings ($40/unit × 12,000 units), and the supplier retained a healthy margin.
Representative analysis based on typical DFMA results. Specific figures are illustrative.
Should Cost Analysis: Spreadsheets vs. Software
Many teams start should-costing in Excel—and for simple parts with known processes, a spreadsheet can work. But as part complexity, volume, and the number of suppliers grow, spreadsheet-based approaches hit structural limits that dedicated should cost modeling software is designed to overcome.
| Capability | Spreadsheet (Excel) | DFMA Should-Cost Software |
|---|---|---|
| Process database | ✗ Manual—you build and maintain it | ✓ 100+ processes with validated cycle-time models |
| Machine & labor rates | ~ Static values you research and enter | ✓ Built-in chargeout rates by machine type and region |
| Material cost library | ~ Manual lookup; stale quickly | ✓ Maintained library with regional pricing |
| Cycle-time estimation | ✗ Requires deep process expertise per part | ✓ Automatic from part geometry and process selection |
| What-if scenarios | ~ Manual cell changes; error-prone at scale | ✓ Change region, material, machine, or volume instantly |
| Audit trail | ✗ Formulas hidden; hard to peer-review | ✓ Every assumption visible and documented |
| Supplier-facing output | ~ Custom formatting needed each time | ✓ Standard reports suppliers recognize |
| Scalability | ✗ One sheet per part; no portfolio view | ✓ Analyze hundreds of parts consistently |
When a spreadsheet is fine—and when it's not
- You're costing fewer than 10 simple parts
- The process is well-known and cycle times are established
- One analyst owns the model end-to-end
- You don't need to compare across regions or machines
- You cost dozens or hundreds of parts per year
- Parts involve unfamiliar processes or materials
- Multiple teams (procurement, engineering, finance) need to use and trust the model
- Supplier negotiations require a credible, repeatable methodology
- You need to model "what if we move production to another region?"
The core risk with spreadsheets is that the model's accuracy depends entirely on the analyst's process knowledge. If cycle-time estimates, machine rates, or material prices are wrong, the should-cost is wrong—and there's no built-in validation. DFMA Should Costing replaces those manual assumptions with a validated, peer-reviewed database that has been refined over decades of manufacturing research.
Negotiating with suppliers using should cost data
Generate precise manufacturing cost estimates in real-time and focus on the true drivers of cost to assess whether a supplier's quote is justified. The software translates complex cost data into a format suppliers readily understand, fostering a transparent and fair supplier-costing process.
- Cycle time
- Setup
- Yield
- Tooling
- Routing
- Overhead
- "Which operation is longer?"
- "Which tolerance/finish is driving this?"
- "What's the setup assumption?"
- Present assumptions in a consistent format
- Suppliers recognize the methodology
- Focus on drivers, not opinions
This approach aligns with the broader philosophy of DFMA: reduce cost by understanding and improving the design and manufacturing process, rather than simply pressuring suppliers on price. To see how this plays out in practice with real supplier data, explore the DFMA software walkthrough.
Implementing should cost analysis in your organization
Adopting should cost analysis as a repeatable practice requires a strategic commitment to data accuracy, cross-functional collaboration, and continuous improvement:
- Establish a cross-functional team—involve procurement, engineering, finance, and manufacturing to ensure all perspectives are covered.
- Invest in advanced costing tools—leverage should cost modeling software such as DFMA Should Costing for accurate, real-time estimates.
- Develop detailed cost models—break down each part's cost structure to compare quotes and pinpoint savings.
- Train your team—ensure stakeholders understand should-cost methodologies and tools.
- Foster transparent supplier relationships—promote open communication and data sharing.
- Monitor and adjust—continually track performance and refine strategies as markets and processes evolve.
Benefits of implementing should cost analysis
- Cost Reduction: Savings based on true manufacturing costs
- Increased Profit Margins: Lower part costs boost profitability
- Improved Supplier Relationships: Transparency and mutual understanding
- Enhanced Negotiation Power: Accurate data drives effective negotiations
- Supply-Chain Resilience: Fair pricing keeps suppliers healthy
Frequently asked questions
What is should cost analysis?
It's a method for estimating true manufacturing cost—then using it to set realistic cost targets and negotiate supplier pricing based on transparent drivers. It is sometimes called should cost modeling.
What is should cost modeling?
Should cost modeling is the process of building a bottom-up cost estimate for a manufactured part based on its materials, geometry, manufacturing processes, and production volume. The resulting model serves as an independent baseline for evaluating supplier quotes and conducting manufacturing cost analysis.
Why is it better than using historical prices?
Historical prices are anchored to past deals and conditions. Should-cost models materials, processing, setup, tooling, and yield so negotiations focus on what drives cost today.
What cost components are typically included?
Most should-cost models include material cost, processing and setup time (using chargeout rates), tooling and amortization, scrap/yield, and an explicit profit approach that reflects value-added work.
How does should cost analysis help supplier negotiations?
It turns negotiations into a problem-solving discussion: identify where estimates differ (cycle time, tooling assumptions, yields, overhead, secondary ops), then align on the drivers that explain the gap.
Can I do should cost analysis in a spreadsheet?
You can start with spreadsheets for simple parts with well-understood processes. However, spreadsheets lack built-in process databases, validated cycle-time models, and regional cost libraries. As part complexity and volume grow, dedicated should-cost modeling software like DFMA provides the accuracy, auditability, and scalability that spreadsheets cannot replicate. See our detailed comparison above.
What is the difference between should cost analysis and manufacturing cost analysis?
Manufacturing cost analysis is the broader discipline of understanding what drives the cost of making a part. Should cost analysis applies that understanding to a specific purchasing decision—comparing a supplier's quote against an independent cost model to identify gaps and negotiate effectively. DFMA supports both by providing the process knowledge, cost databases, and modeling tools needed for either application.
What's the fastest way to start?
Pick 10–20 high-spend parts, build baseline models, and use them to structure supplier conversations. A cross-functional review cadence makes it repeatable.
Which teams should be involved?
The strongest should-cost programs are cross-functional, typically involving procurement, engineering, manufacturing, and finance so both technical feasibility and commercial outcomes are covered.
Ready to build defensible should-cost models?
If you want defensible targets and faster alignment across procurement and engineering, we can walk through how it works in DFMA.